AI✨ empowered manufacturing

BEET Platform

BEET Enterprise

Intelligent Manufacturing at Scale

BEET Enterprise empowers high-volume operations with multi-site visibility, advanced analytics and AI-powered business intelligence – built on the trusted BEET Core 5.0 foundation and designed for organizations connecting 200+ assets.

Who is BEET Enterprise For?

  • More manufacturing facilities with 200+ assets
  • Ideal for companies operating multiple plants or complex production systems
  • Combines out-of-the-box intelligence with flexible customization


Not sure if BEET Core 5.0 or Enterprise is right for you?

Compare the versions.


Your Factory Knows More Than Your ERP or MES Can Tell You

ERP, MES and SCADA systems weren’t designed to deliver real-time, device-level insight. BEET Enterprise fills that gap, capturing motion-level data directly from your factory floor and layering it with AI and analytics to reveal what’s actually happening, in real time. 

Pinpoint the exact bottlenecks holding your line back. Understand where seconds are lost – and where they can be gained to increase jobs per hour (JPH). Prioritize improvements with confidence, not guesswork.

You don’t need to rip and replace your systems. You need a layer of intelligence that works with them.

BEET Enterprise Features

BEET Bot

AI-Powered Insights. Natural Language Simplicity.

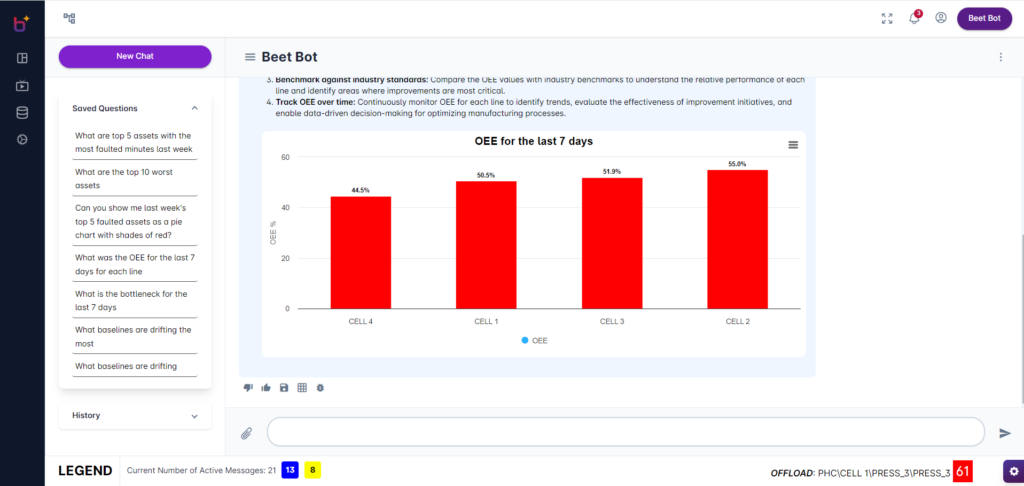
Powered by Gemini, BEET Bot gives teams instant access to real-time insights, performance trends and root cause analysis — just by asking.

Interactive Insights
  • Natural Language Queries: Users can interact with the platform by asking questions in natural language. Example queries include:
    • “What was my OEE on the first shift for Line A?”
    • “What are my top servo faults this month?”
    • “How is my plant running this week?”
  • Instant Analysis: BEET Bot processes these queries, analyzes the relevant data, and returns descriptive insights paired with dynamically generated charts.
Instant Visualization
  • Charts and Graphs: The insights provided by BEET Bot are accompanied by visual representations of the data, such as bar charts and line graphs. This helps users to quickly understand complex information and make informed decisions.
Adaptive Learning
  • User-Driven Prioritization: As users continue to interact with BEET Bot and ask various questions, the platform learns which data points are most important. This continuous learning process allows BEET Bot to prioritize data for future consumption, improving the relevance and accuracy of its responses.

Live Line Intelligence

Total Visibility Into Every Second of Every Cycle

BEET Enterprise gives you deep, device-level analytics across all lines — so you can spot inefficiencies, pinpoint bottlenecks and improve performance with confidence.

Device-Level Precision
  • BEET collects data directly from PLCs using a push-based method, capturing every motion, delay or operator input within the cycle. This allows users to understand why performance dipped, not just when it happened.
Cycle Sequence Browser
  • An interactive timeline that visually breaks down each cycle step-by-step. See where cycle time was lost, identify root causes and prioritize corrective actions with data anyone on your team can understand.
Line Flow Visualization
  • Zoom out from a single station to see the behavior of the entire line. Visualize how delays, faults or operator actions ripple across stations in real time, revealing hidden flow issues.
Global Access, Local Control
  • BEET is web-based and role-based. Whether you’re a supervisor on-site or a leader halfway across the world, you can monitor performance securely and make decisions with confidence.


Customizable Home Page

Your Command Center for Operational Excellence

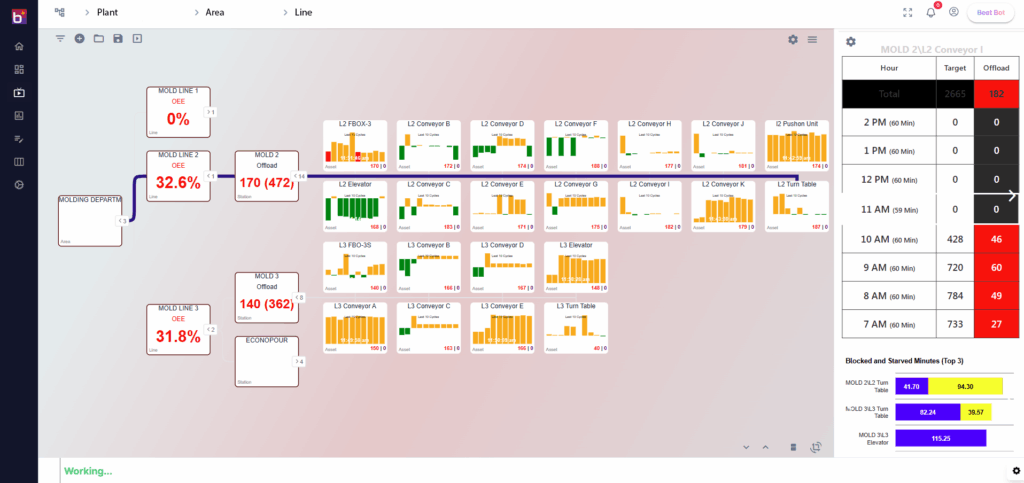
BEET Enterprise enables large manufacturers to monitor and manage performance across plants, installations and lines. With flexible configuration, global and personal views and live data, your teams get exactly the insight they need. 

Customizable Tabs and Widgets
  • Tabs: Organize your views by role, line, or plant. Tabs can be configured to display specific operational perspectives – personal or global.

    Widgets: Select from a wide widget library to display real-time metrics, alerts, or charts. Add, remove or reposition widgets as needed.
Real-Time Data Refresh
  • The home page updates every 60 seconds by default, ensuring your team sees the most current data at all times.
Shift Selector
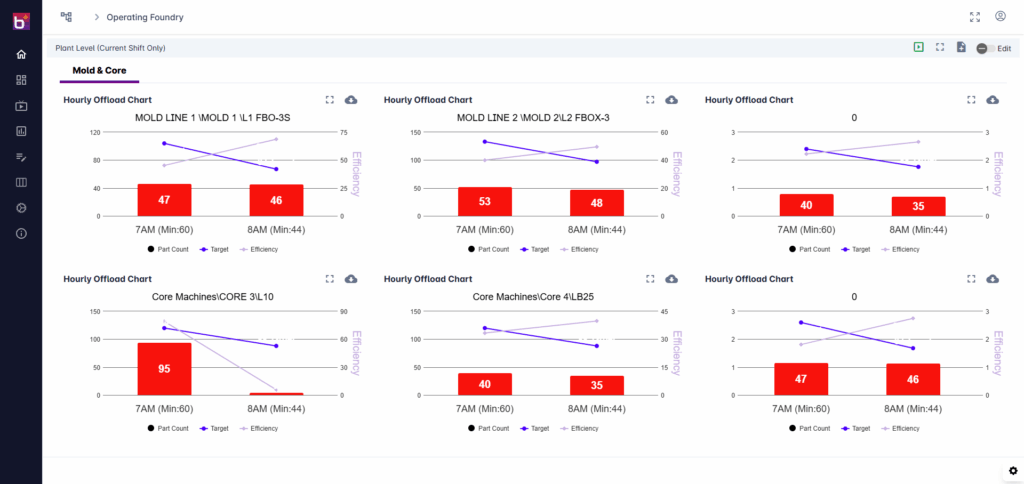
  • Quickly filter data by current or completed shifts to analyze performance and downtime by shift.

Key Metrics Display
  • View key metrics such as Availability, Performance, Quality, MTTR and OEE at a glance, customized by user role.
Live Shift Data
  • Monitor the number of active messages, equipment status and operator activity for the current shift.
Global and Personal Tabs
  • Global Tabs: Created by admins and visible to all users.
  • Personal Tabs: Users can build and save their own views for customized monitoring.
Home Page Editor
  • Click the edit icon on any widget to configure or adjust. The intuitive editor supports fast changes based on evolving business needs.

Data Browser

Turn Raw Data Into Strategic Insight

BEET Enterprise’s Data Browser includes three modules – Cycle, Message and Analog – designed to help you analyze trends, identify root causes and optimize performance over time.

Data Browser
Cycle Browser
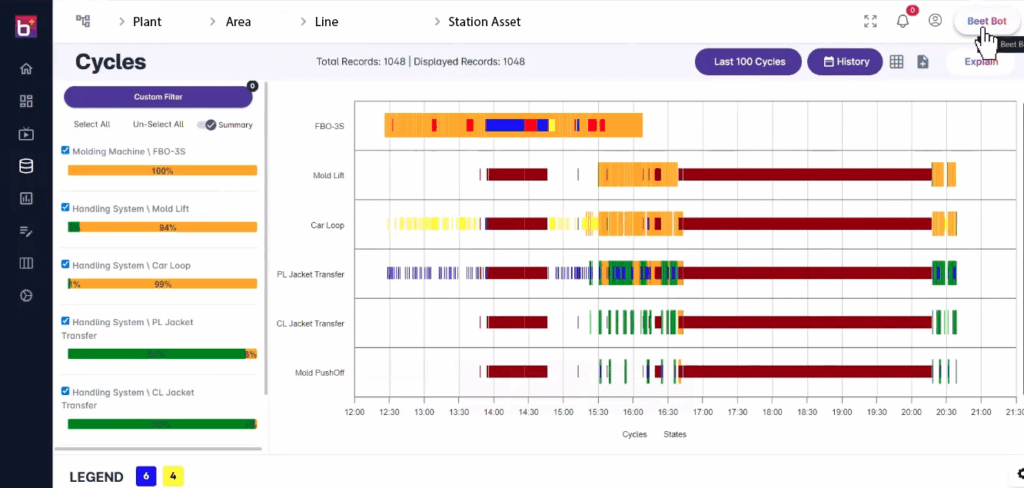
  • View production cycles across lines and shifts, with adjustable historical windows up to 90 days.

Message Browser
  • See fault codes and state changes tied to specific assets or lines, with timestamps and durations.
Analog Browser
  • Visualize continuous variables like temperature, flow, or pressure—ideal for spotting performance drift before it becomes an issue.

Advanced Reporting

Actionable Insights. Automated Delivery.

From daily performance to lowest-performing assets, BEET Enterprise provides standard and customizable reports that empower teams to make informed decisions fast.

Prebuilt Reports
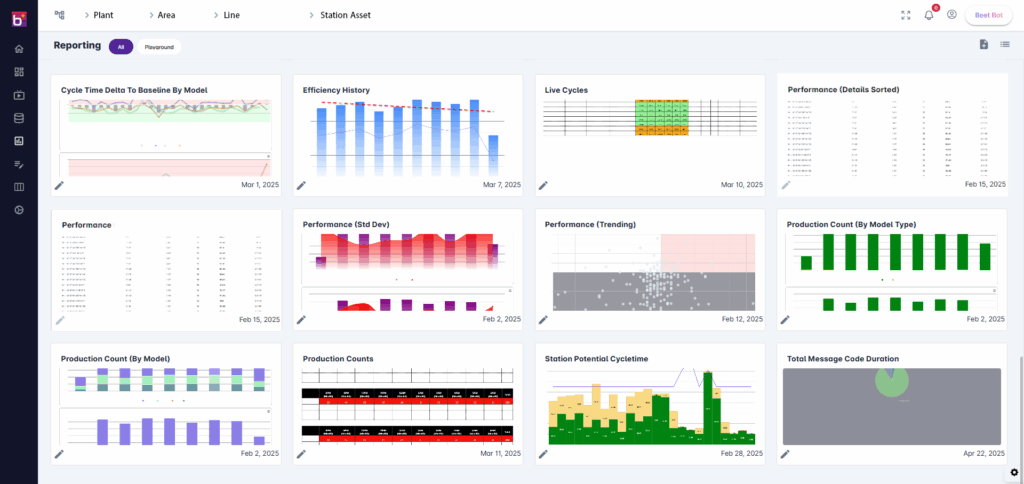
  • Includes templates like Top 3 Worst Assets, OEE Trends and Downtime Analysis.

Custom Reports
  • Create your own using flexible parameters.
Auto Reload
  • Keep dashboards live with data refreshing at set intervals.

Explain Button

Built-in transparency shows logic, source and report rationale—helping build data literacy across teams.

Notes Module

Capture What the Data Doesn’t Say

Record operator observations, shift comments and insights that don’t fit neatly into a report.

Foldered & Labeled
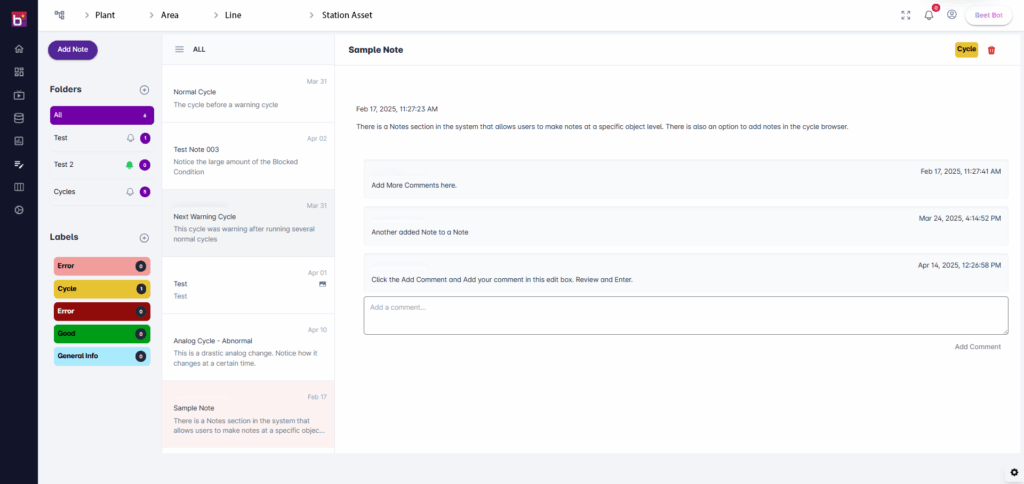
  • Organize notes by site, line or topic.

Collaborative
  • Add comments, edit and share with the team.
Attach Files
  • Screenshots, PDFs or logs for full context.

Task Board

Track and Tackle Operational Tasks

BEET’s built-in task board helps teams assign, track and complete routine and corrective actions with ease.

Visual Workflow
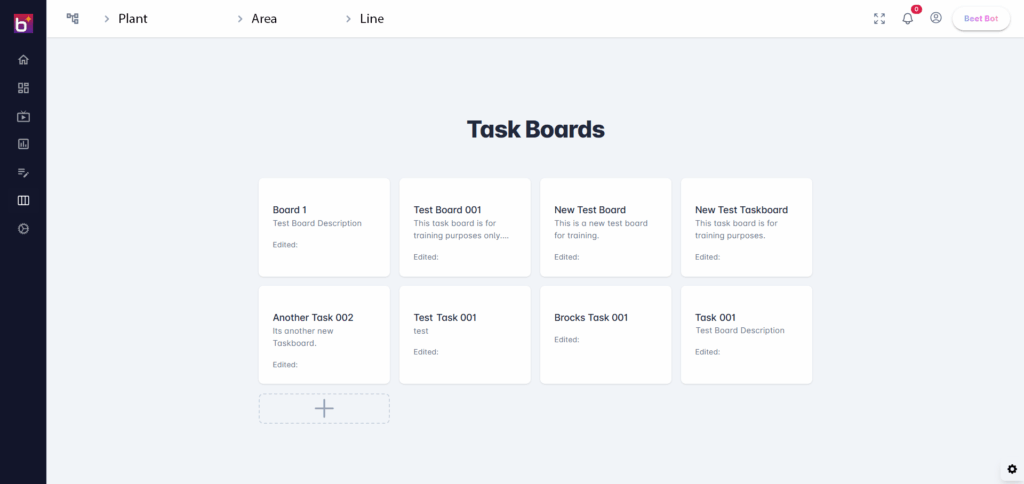
  • Drag-and-drop tasks across To Do, In Progress and Done columns.

Due Dates & Descriptions
  • Assign accountability and keep teams aligned.
Archive Function
  • Keep task boards clean without losing history.

System Administration Tools

Full Control Over Your Operations

BEET Enterprise puts the power in your hands, giving administrators flexible control over multi-site operations, data sources, users and reporting. Manage complex environments with the precision and scalability today’s manufacturers require.

Multi-Site Operations Management
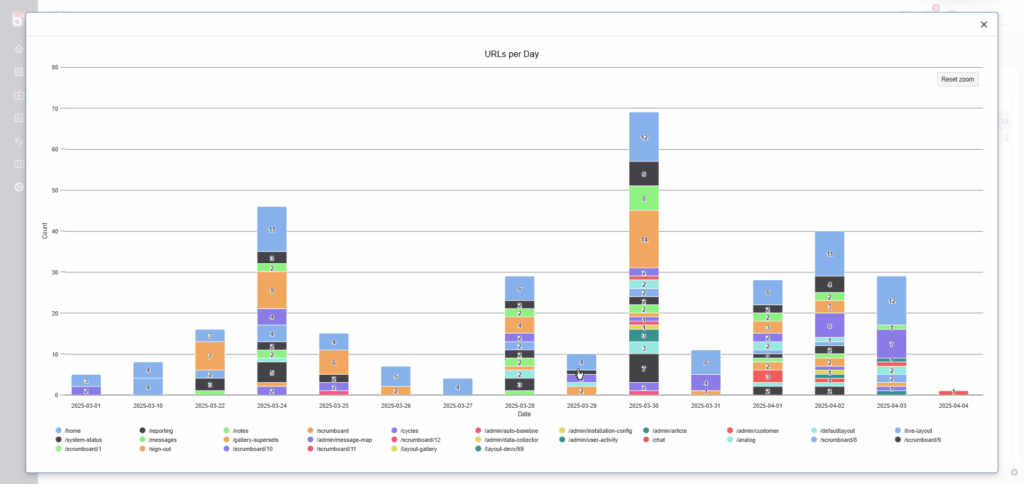
  • Easily manage plants, installations and connected assets through a scalable hierarchy. Navigate global operations or drill into a specific line in seconds.

Data and Device Control
  • Configure Data Collectors, manage device integrations and customize how signals are translated into actionable insights—all without slowing down production.
User and Access Administration
  • Define roles, permissions and system settings to keep your operations secure and efficient. Empower the right teams with the right visibility.

Conditional Alerts

Automate Notifications for Immediate Response to Critical Events

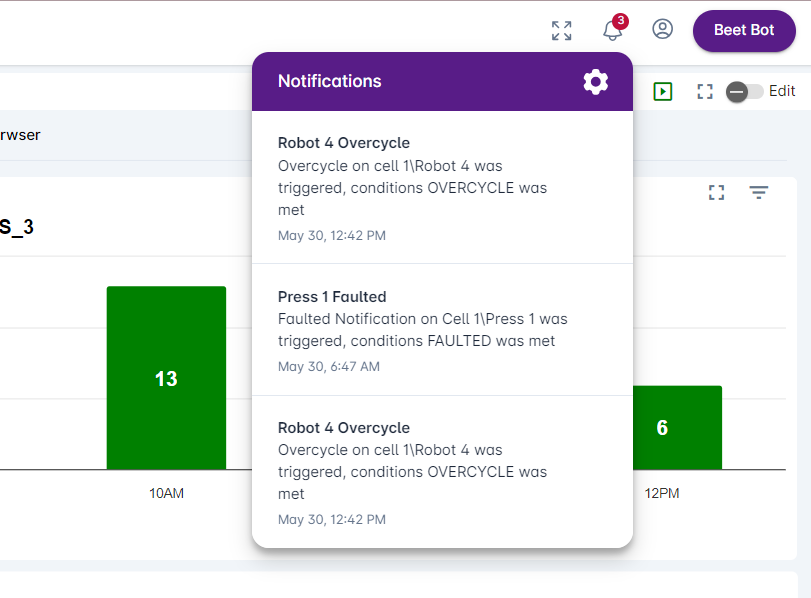
Use BEET’s Conditional Alerts feature to set up automated notifications based on specific criteria, enabling a proactive response to important events.

Setup and Customization
  • User-Defined Criteria: Users can define the conditions that trigger an alert. This includes selecting the asset to monitor, the measure to track (such as downtime or performance metrics), and the specific threshold values.
Notification Types
  • System Notifications: Alerts can be configured to appear as system notifications within the BEET Core interface.
  • Email and Text Messages: Users can also opt to receive alerts via email or text message, ensuring that they are notified even when they are not actively monitoring the system.
Real-World Application
  • Example Scenario: A maintenance supervisor could set up an alert to trigger when a CNC machine experiences more than 5 minutes of downtime. Once this condition is met, the system will automatically send a notification to the relevant team members via their preferred communication method (text, email, or system notification), prompting them to take corrective action.
Real-Time Monitoring
  • Live Updates: The conditional alerts are monitored and updated in real-time, providing immediate feedback when defined conditions are met. This helps in maintaining continuous oversight and quick response to potential issues.
Notifications Panel
  • Consolidated Alerts: All active and historical alerts can be viewed in a dedicated notifications panel within the BEET Core 5.0 interface. This panel provides a comprehensive overview of all conditions that have been met and the corresponding actions that need to be taken.

Advancing Manufacturing Performance in Industry 4.0

Discover how manufacturers can extend Industry 4.0 beyond the four walls of the plant — creating connected ecosystems that deliver real-time insights and drive intelligent, agile operations.

Ready to scale intelligent manufacturing across your enterprise? Empower your teams, connect your operations and drive real-world results with BEET Enterprise.